July 28, 2026
Of the three proposals in the Triptych Project, my multi-year odyssey to add a few small-but-powerful features to HTML, the one that generates the most questions is Button Actions.
The proposal itself is very straightforward:
we want to add the action and method attributes to the button.
<button action="/begin" method="GET">Start</button>
Button Actions are such a simple primitive that people often ask why they’re needed.
The answer rests on a distinction that web users intuitively understand but rarely have to think about directly:
the difference between a button and a link.
I added a detailed “Buttons vs Links” section to the proposal, but I think it deserves a blog-style explanation as well, because most of the existing ones miss the mark.
Links represent a destination while
buttons represent an action.
Functionally, this means that links let users control what context they open in, while buttons don’t.
Web browsers offer countless affordances for re-contextualizing a link.
Clicking or tapping the link will navigate the current page to that destination.
Mouse users can middle-click the link to open it in a new tab or hover over the link to see where it goes.
Context menus (right-click on desktop, long tap on mobile) have lots of link-specific options.
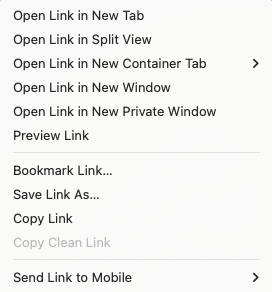
Web users are very familiar with the features that come with links. They know how to open them, copy them, bookmark them, share them with friends, and maintain them in an inadvisable number of browser tabs.
The semantics of a link—the notion that they represent an independently-navigable destination—make it possible for browsers to build all these features.
The hyperlink predates the invention of the browser tab, but when browsers added tabs, websites didn’t have to do anything to support them;
links represented destinations that could be re-contextualized, so browsers could simply invent a new context for them to open in.
Every website instantly got upgraded with a huge new feature.
Buttons have none of these features.
By default, they cannot be middle-clicked, control-clicked, or hovered over for more information.
Buttons don’t allow you to copy their action the way you can copy the href of a link.
Their context menus contain no affordances for saving the action or doing it somewhere else.
These are not omissions, but deliberate choices based on the button’s semantics:
buttons trigger actions inside a specific browsing context (almost always the current one).
Copying, sharing, bookmarking—these are all features for re-contextualizing the action of a link.
Buttons serve a complimentary purpose because they don’t allow for any of that.
A common misconception is that links are for navigating the page, while buttons are for everything else.
This is incorrect on both counts.
Buttons regularly perform navigations.
Clicking a logout button navigates the current page to a logged-out one;
clicking a “search” button navigates the current page to the query results.
Both of these are navigations in the HTML standard.
They change the URL, they get logged in the session history, and they load a new page.
And links are often used in situations where they don’t trigger navigations.
Relative links can jump around the current page;
mailto links can open email clients;
download links can save a file to your computer.
None of these are navigations, but they are all “destinations” that can be opened, saved, and shared in customizable ways.
Navigations should be represented as buttons when their action happens in a fixed context that is not available to be re-contextualized (e.g. bookmarked, shared, middle-clicked, etc.).
A frequent place this comes up is with forms that let you edit something you’ve already saved, like a comment on a website.
When you click “Edit”, the website shows you an editable text area with options like this:
Users will easily intuit what each button does:
- “Save” updates the comment with whatever is in the
<textarea>
- “Save Draft” saves the content of the
<textarea> without publishing it
- “Cancel” closes the editable form
- “Delete” removes the comment entirely
Should “Cancel” be a link?
No!
Its job is to close the edit view.
Not only does making this a link incorrectly communicate its purpose—visually and otherwise—but it saddles the form “control” with lots of features, like bookmarking and middle-clicking, that have incorrect behavior.
There are many plausible ways these buttons could be implemented, but none of those implementations should present themselves to the user as a link.
With Button Actions, this entire UX could be implemented with just HTML.
<form action="/comments/123" method="POST">
  <textarea name="content">I had a great day today!</textarea>
  <button>Save</button>
  <button formaction="/comments/123/draft">Save Draft</button>
  <button action="/comments/123" method="GET">Cancel</button>
  <button action="/comments/123" method="DELETE">Delete</button>
</form>
The first two buttons use existing HTML features, the second two buttons are made possible by Button Actions.
(I’m also taking advantage of Triptych’s DELETE support, but you could do the URL method hack without it.)
<button action="/" method="GET">Cancel</button>
<button action="/comments/123" method="DELETE">Delete</button>
Philosophically, Button Actions create a generic control that can redraw the current context with a network request.
Buttons already have the ability to do this with certain limitations;
this proposal removes those limitations.
Practically, this allows web authors to implement state transitions by navigating to views.
Those views might even already exist as standalone destinations, in which case authors can trivially re-use existing routes while representing the action correctly in the UI.
This is a great pattern that HTML should encourage!
Unfortunately, without Button Actions, erroneously making this button a link is the only way that we have to implement this interface without scripting.
<form action="/comments/123" method="POST">
  <textarea name="content">I had a great day today!</textarea>
  <button>Save</button>
  <button formaction="/comments/123/draft">Save Draft</button>
  <a href="/comments/123" class="button">Cancel</a>
  <button action="/comments/123" method="DELETE">Delete</button>
</form>
This is obviously an anti-pattern, but it’s an anti-pattern supported by major design systems, because buttons lack the ability to do basic navigation without forms.
When building a website that works without JavaScript (a requirement for UK government sites), links are the only choice.
The US Web Design System (USWDS) even contains an official affordance for it:
Add class="usa-button" to a link and it will look like a button.
Making a link look like a button, however, does not make the link behave like a button.
USWDS uses JavaScript to implement spacebar activation, but JavaScript can’t do anything about the litany of other behaviors that differentiate buttons from links, like context menus.
Links (even those with role=button) will still look like links in reader mode or other custom views.
That’s the fundamental consequence of violating HTML semantics—the page will be broken for some users because authors cannot possibly account for all the different ways that people interact with a web page.
The web simply wouldn’t work if they had to.
Navigations are the broadest tool that web authors have to control the user experience—HTML just needs to complete the <button>’s ability to trigger them.
Doing so makes the web simpler, safer, and more accessible for all.
If you’d like to support the effort, the best way is to like the Button Actions issue on GitHub and share examples of why the proposal would be valuable to you.
- Big shoutout to The Django Software Foundation for their support of this proposal!
- I am currently working on an analysis to demonstrate that Button Actions do not introduce any new XSS vulnerabilities to existing web sites. Supporting this proposal doesn’t resolve that issue, but it does demonstrate to WHATWG that web authors have this need and that it’s worth studying.
- This blog focuses on buttons that trigger GET requests without forms, because that’s where the overlap with links is, but buttons that trigger unsafe requests without forms are also very useful.
DELETE requests are probably the most common use-case, because they usually don’t require any additional data.
- One interesting case for buttons that trigger
POST or PUT requests without a form is “likes” on social sites. HackerNews, for instance, uses links for upvotes, which is in wild violation of HTTP semantics. I understand why they do it though: it’s simpler and works without JavaScript. That’s why it’s necessary to make Button Actions not just possible, but convenient.
- The proposal addresses all the existing workarounds for the lack of this functionality and explains why they’re not sufficient.
- The big picture goal with Triptych to is to give web authors a simple and semantic way to model a full CRUD lifecycle in HTML, because that’s all the vast majority of web services need to do.
- All the Triptych Proposals complement each other—Button Actions are even more useful with additional methods and partial page replacement—but I try to make the case for each one in isolation, both as an anti-logrolling mechanism and because they are genuinely useful on their own.